
코인도리 칼럼
리스트 보기
Search
비트겟 비트코인 백테스트 무료 배포
2025/06/11 13:23
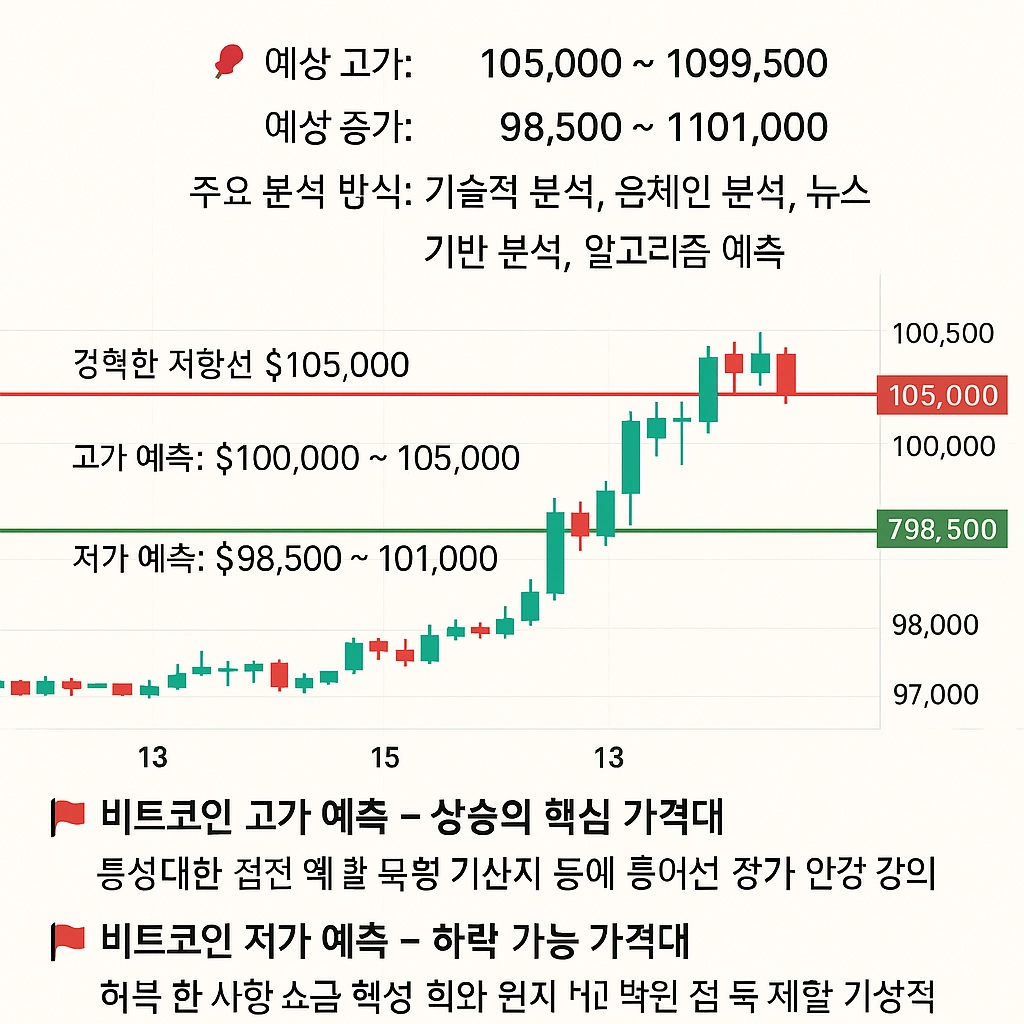
BTCUSDT 2025년 5월 16일 가격 예측 (고가, 저가, 종가 분석)
2025/05/16 01:28

일론 머스크, 정부 효율부(DOGE) 수장으로서의 활동과 논란
2025/02/22 07:58

바이비트, 역대 최대 규모 해킹 피해…북한 라자루스 그룹 소행 의혹
2025/02/22 03:14
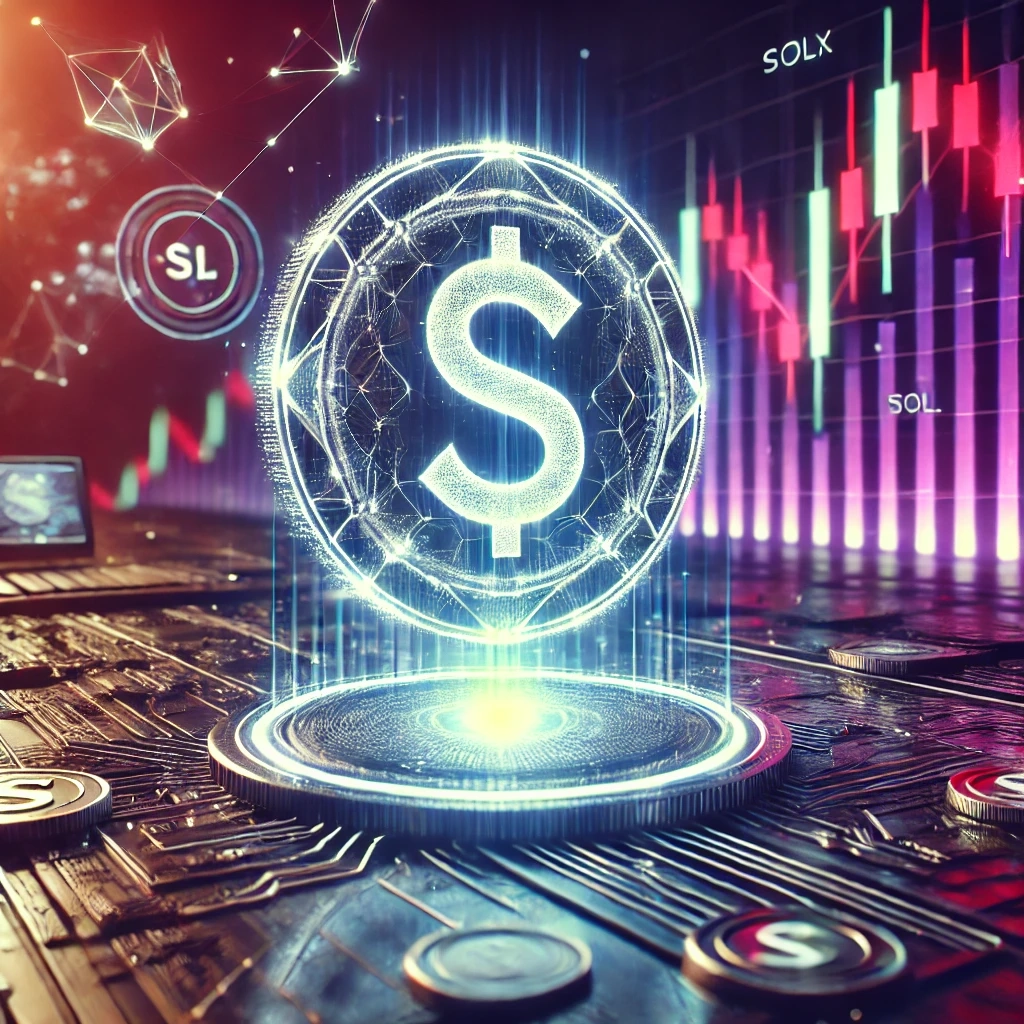
솔라나(Solana) 최신 동향: 밈코인 스캔들로 인한 시장 변동과 투자자 동향
2025/02/21 18:20
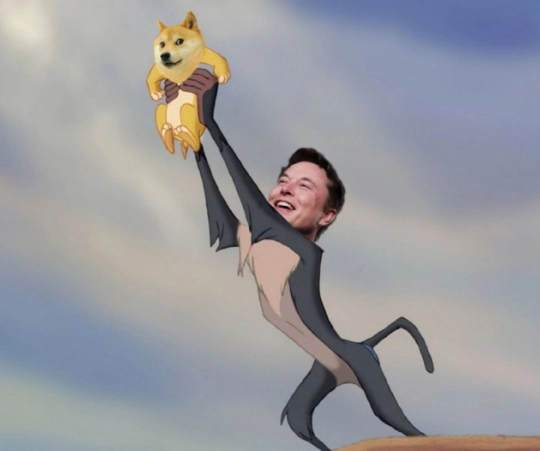
도지코인(DOGE), 상승 가능성과 시장 동향 분석 
2025/02/21 18:01
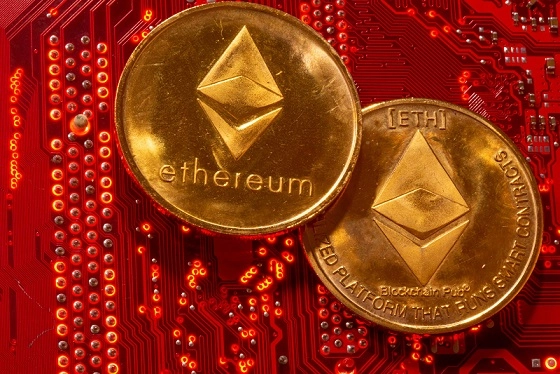
이더리움, 보안 이슈와 시장 동향 분석 

2025/02/21 17:59
코인도리_단마

비트코인, 9만8000달러 돌파와 함께 새로운 전환점 맞이 
2025/02/21 17:58
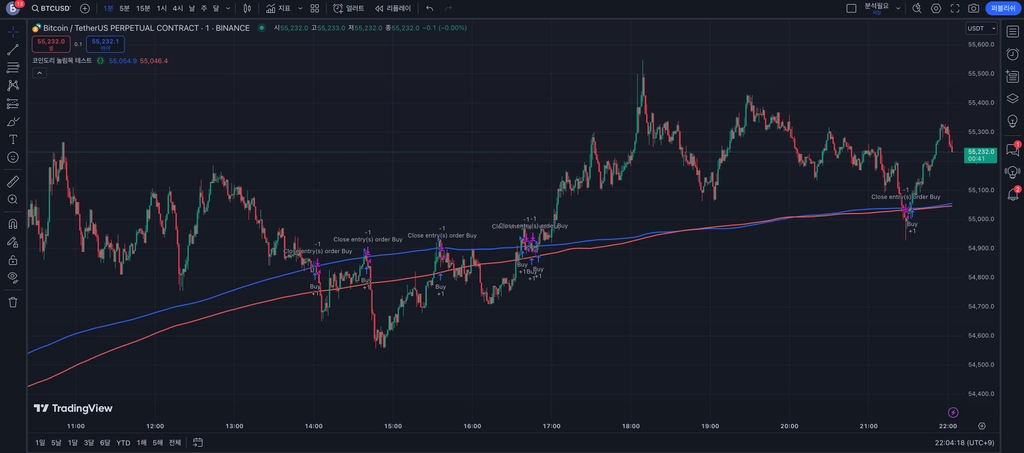
[트레이딩뷰 인디케이터] 눌림목[자작 샘플]
2024/09/09 12:50
찍먹단타형_스틸
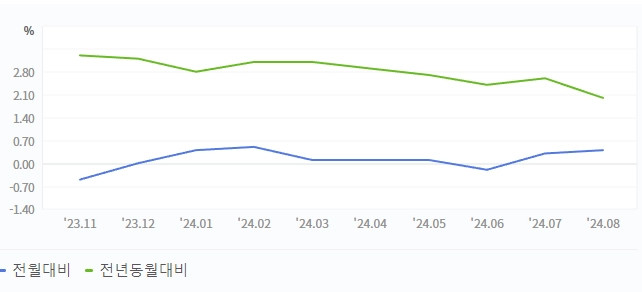
비트코인 시장의 반등 연준의 금리 인하 가능성
2024/09/09 05:32
코인도리_단마
【목차】
가상 화폐 커뮤니티에서 활동하면서, 많은 사람들이 스마트폰, 태블릿 PC, 노트북 중에 어떤 기기를 사용해야 하는지 또는 사용해도 괜찮은지 자주 질문합니다.
데스크탑 대신 다른 기기로 가상 화폐를 투자하는 분들이 있을 것으로 생각되어, 매매에 가장 적합한 기기에 대해 설명해보도록 하겠습니다.
Q. 스마트폰과 태블릿, 어느 쪽이 좋나요?
스마트폰은 어디서나 자유롭게 가상 화폐를 투자할 수 있는 편리함이 있습니다. 그러나 높은 승률과 이익을 얻으려면 여러 요소들을 동시에 고려해야 합니다. 비트코인 차트, 매매하는 코인의 차트와 보조지표, 실시간 차트 패턴, 분봉, 호가창 등을 함께 분석해야 합니다. 하지만 화면 크기가 작아 필요한 정보를 한눈에 볼 수 없기 때문에 스마트폰만으로 매매를 하는 것은 위험이 큽니다.
가상화폐 투자를 위한 최적의 기기와 사양에 대해서
2024/09/06 08:37
안전추구형_진영
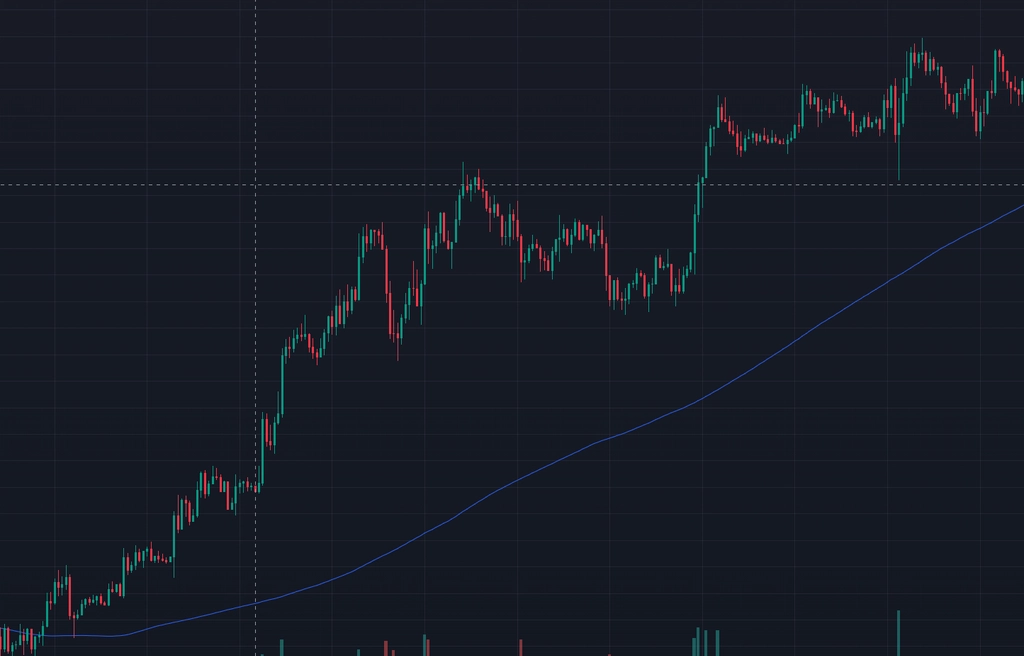
비트코인 눌림목 매매법을 활용한 자동매매전략
2024/09/06 05:28
코인도리_단마
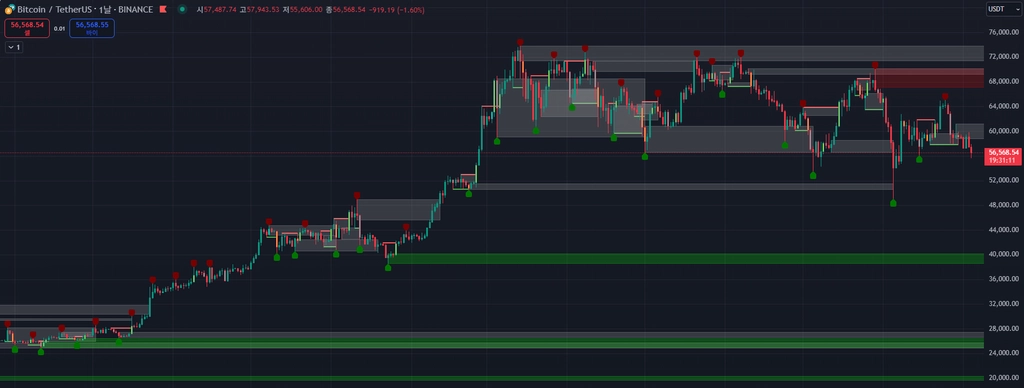
[트레이딩뷰 인디케이터] 오더블록
2024/09/04 04:26
찍먹단타형_스틸
안녕하세요, 초현실 재테크를 공부하는 한걸음더 에디입니다. 오늘은 변동성이 큰 가상화폐 시장에서 안정적이면서도 효과적인 투자 방법으로 주목받고 있는 **이더리움 자동매매 프로그램 '코인도리'**에 대해 알아보겠습니다.
가상화폐 시장의 변동성과 투자 기회
이더리움, 비트코인, 솔라나와 같은 가상화폐는 블록체인 기술을 기반으로 한 투자 자산으로 주목받고 있습니다. 특히 이더리움은 스마트 계약 기능 덕분에 더욱 주목받고 있으며, 최근 몇 년간 변동성 높은 시장에서도 꾸준히 투자자들의 관심을 받고 있습니다.
2023년 하락세를 보였던 이더리움은 다시 반등하며 2024년에도 강세를 이어가고 있습니다. 이러한 높은 변동성은 수익 기회를 제공하지만, 동시에 큰 손실 위험도 함께 내포하고 있습니다. 그래서 많은 투자자들이 안정적이면서도 효율적인 투자 방법을 찾고 있습니다.
이더리움 자동매매 프로그램 '코인도리'
이처럼 변동성이 큰 시장에서 손쉽게 투자할 수 있는 방법으로 **이더리움 자동매매 프로그램 '코인도리'**가 등장했습니다. 이 프로그램은 시장 분석과 빠른 거래 실행을 자동으로 처리해 주며, 초보자부터 숙련자까지 누구나 쉽게 이용할 수 있는 장점이 있습니다.
특히 코인도리는 Bitget 거래소를 기반으로 설계된 프로그램입니다. Bitget은 글로벌 암호화폐 거래소 중 하나로, 안정성과 신뢰성을 자랑합니다. 코인도리는 Bitget과의 완벽한 연동을 통해 빠르고 정확한 거래를 보장합니다. 이로 인해, 사용자들은 Bitget의 강력한 거래 인프라를 활용하면서 동시에 코인도리의 자동매매 기능을 최대한 활용할 수 있습니다.
퀀트 투자: 데이터를 활용한 효율적인 투자
코인도리는 퀀트 투자 기법을 활용하여 방대한 데이터를 기반으로 시장을 분석하고, 이를 바탕으로 최적의 매수·매도 타이밍을 자동으로 결정합니다. 퀀트 투자는 수학적 모델과 알고리즘을 사용해 투자 결정을 내리는 방식으로, 감정적 판단을 배제하고 객관적인 데이터에 근거한 효율적인 투자를 가능하게 합니다.
이더리움 자동매매 프로그램 '코인도리'로 매수하는 법
2024/08/30 08:31
<!DOCTYPE html>
<html lang="ko">
<head>
<meta charset="UTF-8">
<meta name="viewport" content="width=device-width, initial-scale=1.0">
<title>일일 비트코인 거래 수익 현황</title>
<style>
body {
font-family: Arial, sans-serif;
background-color: #f0f4f8;
color: #333;
margin: 0;
padding: 0;
}
.container {
max-width: 900px;
margin: 0 auto;
padding: 20px;
}
.header {
background-color: #1b3a57;
color: #ffffff;
padding: 20px;
border-radius: 8px;
text-align: center;
}
.header h1 {
margin: 0;
font-size: 24px;
}
.header p {
margin: 5px 0 0;
}
.summary {
display: flex;
justify-content: space-between;
margin-top: 20px;
}
.summary div {
flex: 1;
background-color: #ffffff;
padding: 20px;
border-radius: 8px;
text-align: center;
margin: 0 10px;
box-shadow: 0 0 10px rgba(0, 0, 0, 0.1);
}
.summary div h3 {
margin: 0;
font-size: 18px;
color: #1b3a57;
}
.summary div p {
margin: 10px 0 0;
font-size: 36px;
color: #17a2b8;
}
.summary div:first-child {
margin-left: 0;
}
.summary div:last-child {
margin-right: 0;
}
.charts {
display: flex;
justify-content: space-between;
margin-top: 20px;
}
.chart {
flex: 1;
background-color: #ffffff;
padding: 20px;
border-radius: 8px;
text-align: center;
margin: 0 10px;
box-shadow: 0 0 10px rgba(0, 0, 0, 0.1);
}
.chart canvas {
max-width: 100%;
height: auto;
}
.table-section {
margin-top: 20px;
background-color: #ffffff;
padding: 20px;
border-radius: 8px;
box-shadow: 0 0 10px rgba(0, 0, 0, 0.1);
}
table {
width: 100%;
border-collapse: collapse;
margin-bottom: 20px;
}
table th, table td {
padding: 12px;
text-align: center;
border-bottom: 1px solid #ddd;
}
table th {
background-color: #1b3a57;
color: #ffffff;
}
table tbody tr:last-child td {
border-bottom: none;
}
.final-summary {
display: flex;
justify-content: space-between;
margin-top: 20px;
}
.final-summary div {
flex: 1;
background-color: #ffffff;
padding: 20px;
border-radius: 8px;
text-align: center;
margin: 0 10px;
box-shadow: 0 0 10px rgba(0, 0, 0, 0.1);
}
.final-summary div h3 {
margin: 0;
font-size: 18px;
color: #1b3a57;
}
.final-summary div p {
margin: 10px 0 0;
font-size: 36px;
color: #17a2b8;
}
.final-summary div:first-child {
margin-left: 0;
}
.final-summary div:last-child {
margin-right: 0;
}
.evaluation {
background-color: #ffffff;
padding: 20px;
border-radius: 8px;
text-align: center;
box-shadow: 0 0 10px rgba(0, 0, 0, 0.1);
margin-top: 20px;
}
.evaluation p {
margin: 0;
font-size: 16px;
color: #1b3a57;
}
</style>
<script src="https://cdn.jsdelivr.net/npm/chart.js"></script>
</head>
<body>
<div class="container">
<div class="header">
<h1>일일 비트코인 거래 수익 현황</h1>
<p>2024-08-21</p>
</div>
<div class="summary">
<div>
<h3>총 거래횟수</h3>
<p>123회</p>
</div>
<div>
<h3>승률</h3>
<p>83%</p>
</div>
</div>
<div class="charts">
<div class="chart">
<h3>시간대별 거래횟수</h3>
<canvas id="timeChart"></canvas>
</div>
<div class="chart">
<h3>포지션별 수익률</h3>
<canvas id="positionChart"></canvas>
</div>
</div>
<div class="table-section">
<h3>거래내역</h3>
<table>
<thead>
<tr>
<th>심볼</th>
<th>포지션</th>
<th>진입가</th>
<th>정리가</th>
<th>수익률</th>
</tr>
</thead>
<tbody>
<tr>
<td>BTCUSDT</td>
<td>SHORT</td>
<td>59636.28</td>
<td>59674.3</td>
<td>0.06%</td>
</tr>
<tr>
<td>ETCUSDT</td>
<td>LONG</td>
<td>2597.72</td>
<td>2599.81</td>
<td>0.05%</td>
</tr>
<tr>
<td>ETCUSDT</td>
<td>SHORT</td>
<td>2597.95</td>
<td>2595.71</td>
<td>0.07%</td>
</tr>
<tr>
<td>BTCUSDT</td>
<td>LONG</td>
<td>58995.7</td>
<td>59066</td>
<td>0.12%</td>
</tr>
<tr>
<td>BTCUSDT</td>
<td>SHORT</td>
<td>59115</td>
<td>58923.9</td>
<td>0.34%</td>
</tr>
</tbody>
</table>
</div>
<div class="final-summary">
<div>
<h3>누적 수익률</h3>
<p>1,023%</p>
</div>
<div>
<h3>누적 승률</h3>
<p>93%</p>
</div>
</div>
<div class="evaluation">
<p>어제의 거래는 전체적으로 긍정적인 성과를 보였습니다.<br>총 10건의 거래 중 7건이 이익을 기록하며, 70%의 승률을 달성했습니다.<br>평균 실현 수익은 0.34%로, 큰 손실 없이 안정적인 수익을 유지한 점이 주목할 만합니다.</p>
</div>
</div>
<script>
// 시간대별 거래횟수 막대 그래프
const ctx1 = document.getElementById('timeChart').getContext('2d');
const timeChart = new Chart(ctx1, {
type: 'bar',
data: {
labels: ['0시', '2시', '4시', '6시', '8시', '10시', '12시', '14시', '16시', '18시', '20시', '22시'],
datasets: [{
label: '시간대별 거래횟수',
data: [3, 7, 5, 8, 6, 12, 15, 10, 9, 7, 5, 6],
backgroundColor: '#17a2b8'
}]
},
options: {
scales: {
y: {
beginAtZero: true
}
}
}
});
// 포지션별 수익률 도넛형 차트
const ctx2 = document.getElementById('positionChart').getContext('2d');
const positionChart = new Chart(ctx2, {
type: 'doughnut',
data: {
labels: ['롱', '숏'],
datasets: [{
data: [55, 45],
backgroundColor: ['#007bff', '#dc3545']
}]
},
options: {
responsive: true,
plugins: {
legend: {
position: 'bottom',
}
}
}
});
</script>
</body>
</html>
[2024.08.21] 비트겟 수익현황
2024/08/19 08:48
<h2>어제의 비트코인 거래내역 리뷰</h2>
<p>
어제는 총 10건의 비트코인 거래가 이루어졌으며, 전반적인 성과를 살펴보겠습니다. 각 거래는 진입가, 정리가, 그리고 실현된 손익(%)을 기준으로 평가되었습니다.
</p>
<ul>
<li>1. 진입가: 26,400, 정리가: 26,500, 실현 손익: 0.38%</li>
<li>2. 진입가: 26,350, 정리가: 26,600, 실현 손익: 0.95%</li>
<li>3. 진입가: 26,550, 정리가: 26,450, 실현 손익: -0.38%</li>
<li>4. 진입가: 26,300, 정리가: 26,700, 실현 손익: 1.52%</li>
<li>5. 진입가: 26,450, 정리가: 26,400, 실현 손익: -0.19%</li>
<li>6. 진입가: 26,480, 정리가: 26,550, 실현 손익: 0.26%</li>
<li>7. 진입가: 26,500, 정리가: 26,600, 실현 손익: 0.38%</li>
<li>8. 진입가: 26,530, 정리가: 26,650, 실현 손익: 0.45%</li>
<li>9. 진입가: 26,400, 정리가: 26,300, 실현 손익: -0.38%</li>
<li>10. 진입가: 26,600, 정리가: 26,700, 실현 손익: 0.38%</li>
</ul>
<p>
어제의 거래는 전체적으로 긍정적인 성과를 보였습니다. 총 10건의 거래 중 7건이 이익을 기록하며, 70%의 승률을 달성했습니다. 평균 실현 손익은 0.34%로, 큰 손실 없이 안정적인 수익을 유지한 점이 주목할 만합니다.
</p>
<p>
특히, 1번과 4번 거래는 각각 0.38%와 1.52%의 이익을 기록하며, 어제의 수익률을 크게 끌어올리는 데 기여했습니다. 반면, 3번과 9번 거래에서는 각각 -0.38%의 손실이 발생했으나, 이 손실은 전반적인 포트폴리오에 큰 영향을 미치지 않았습니다.
</p>
<p>
어제의 결과를 통해 현재의 매매 전략이 대체로 성공적임을 알 수 있습니다. 하지만, 일부 거래에서 발생한 손실을 줄이기 위해 리스크 관리 측면에서의 보완이 필요할 수 있습니다. 앞으로도 시장 상황을 면밀히 분석하고, 손익 비율을 더욱 개선할 수 있는 전략적 접근이 필요합니다.
</p>

2024년 8월 둘째주 비트겟 수익인증
2024/08/19 08:47